
NHL News
Matt Perri reviews trade deadline
Matt Perri, former Director of Analytics for the Arizona Coyotes, reviews the trade deadline action compared to the expectations from the PuckPedia Perri Pick Value Calculator and PuckPedia Perri Cap Relief Calculator. Check them out!
![]()
![]()
Part III: Deadline Review
The deadline has come and gone and it’s time to see how well our cap relief tool did.
We have four new double retention trades to add to our previous sample of nine:
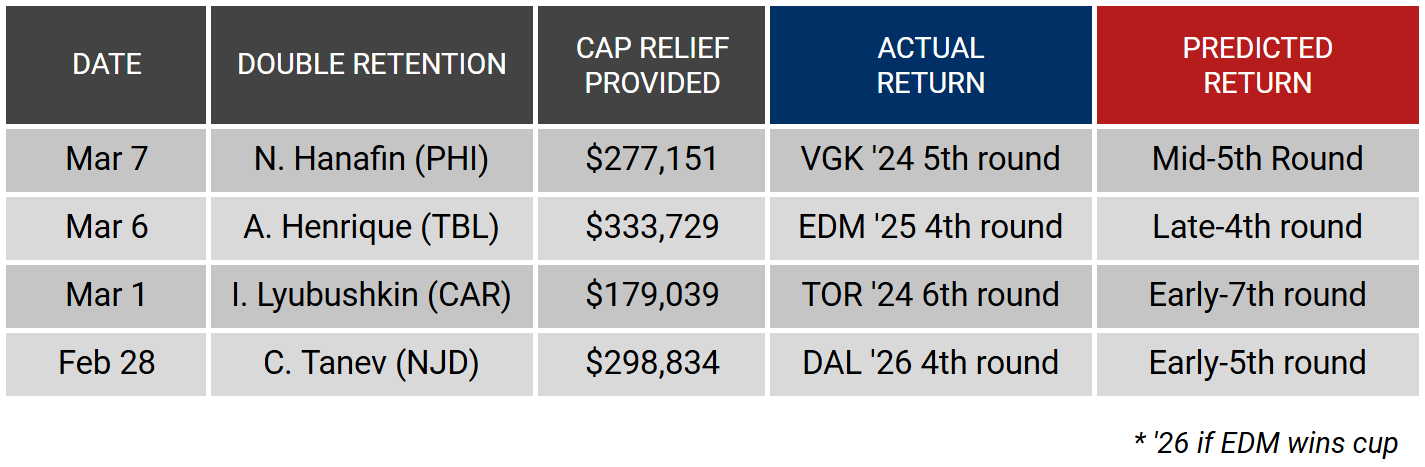
Both cases with round mismatches involved a likely late round pick and a predicted early round pick in the next round, which is what we’d expect if the teams were trying to find the closest pick equivalent based on a model or research similar to ours. If we project the picks that were traded based on PTS% rank as of the morning each trade was made (all pick projections in this article are projected this way), the average difference from our projection is 8.5 picks, plus or minus:
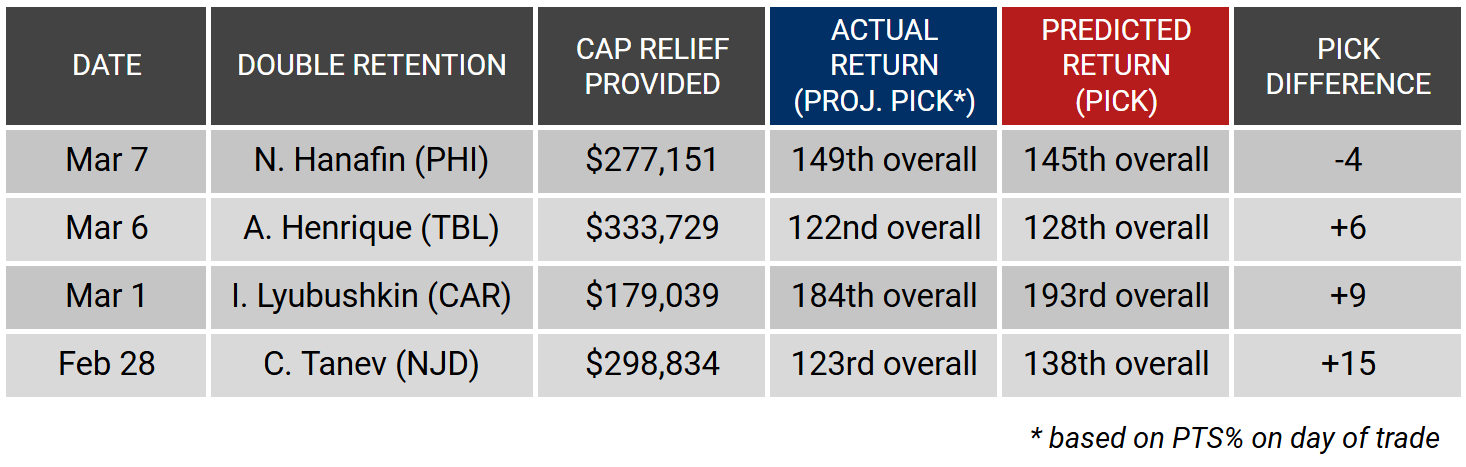
Not bad. Honestly, I don’t think it could have performed better.
Seventh Round Throw-Ins
Our tools can also help analyze other trades from the deadline.
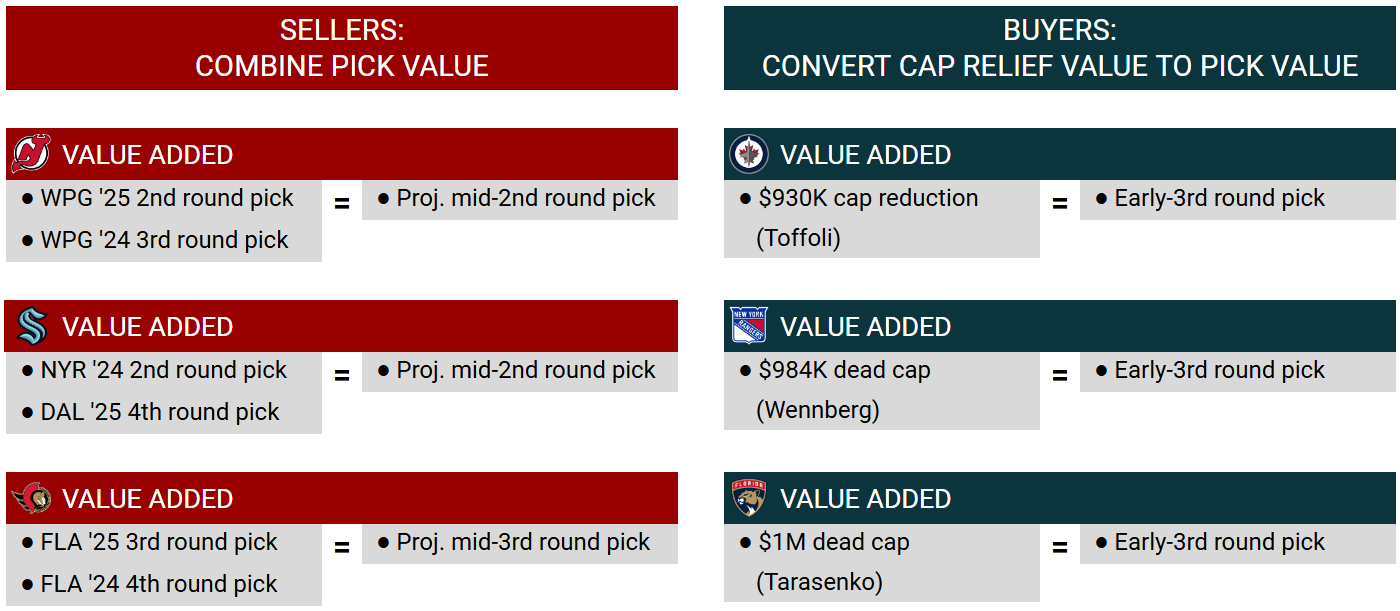
There were a few deals that involved draft capital being exchanged both ways in addition to a player. We can look up the difference on our pick value chart to see the actual value exchanged for each deal. Sellers are in red and buyers are in blue:
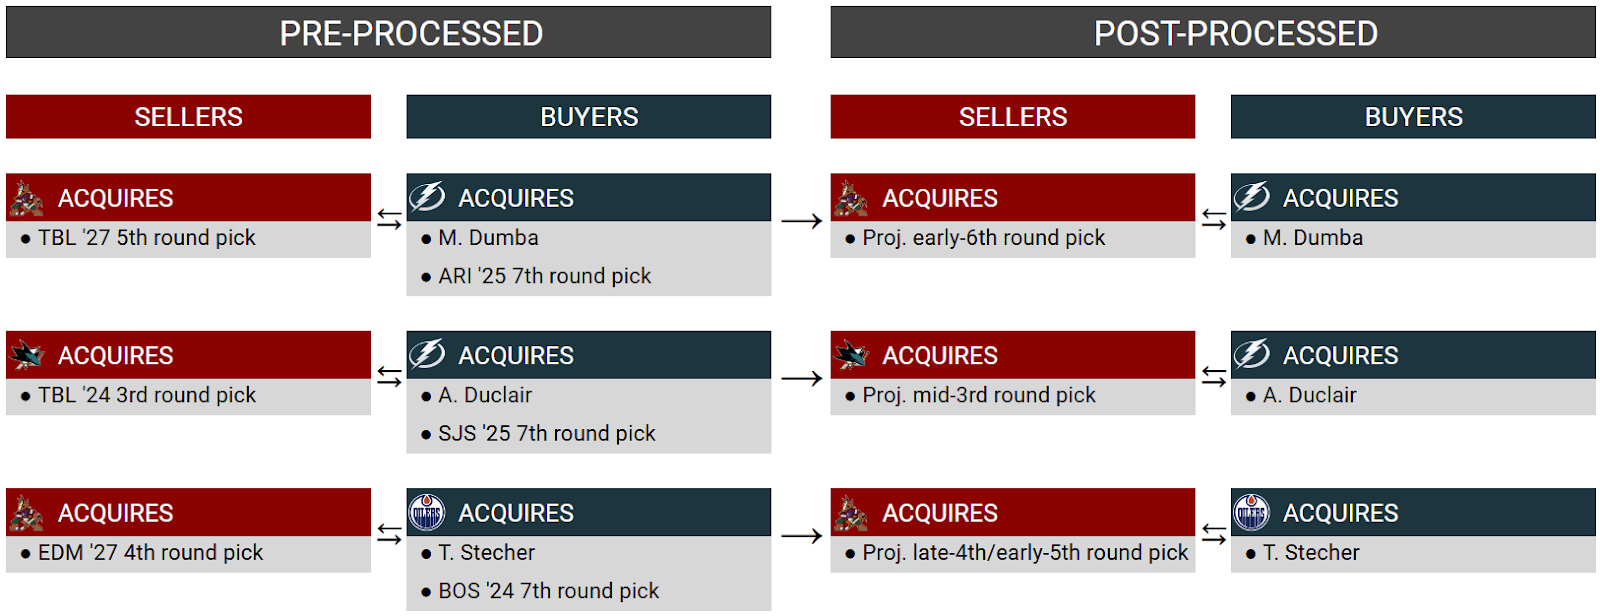
The trades are laid out in the chart on the left side of the graphic above. Notice that in each case, a seventh round pick sweetener was sent to the team who acquired the rental player (the buyer). In the post-processed chart on the right, for each trade, the value of the seventh round pick is subtracted from the value of the pick received by the seller. The resulting difference is the overall value that the seller received in the trade, according to the model.
Looking at the results, it turns out those seventh round picks didn’t really move the needle much.
Fifty Percent Retentions
Here’s another kind of deal that we can look at. We can use both the pick value and cap relief tools to get a sense of the total value exchanged. Here are three similar examples from the deadline:
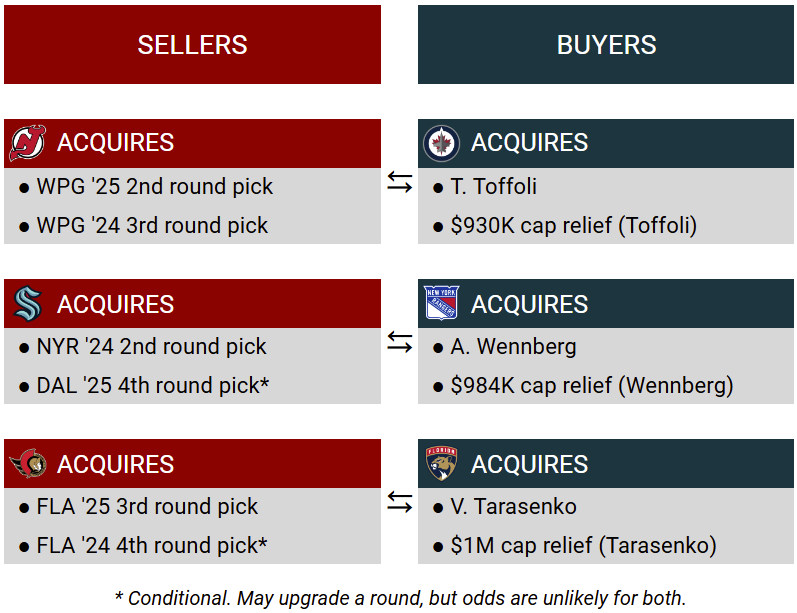
The first step is to reduce the draft pick packages received by the seller into single picks based on our pick value chart (remember that all projections for pick order are based on PTS% rank as of the deadline). At the same time, the amount of cap relief that the buyer received is converted into an equivalent draft capital value:
The final step is to remove the value of the retention from the total value of the picks received. Since the sellers provided the buyers with cap relief, we must assume that part of the draft capital that the sellers received was compensation for this relief. Therefore, we subtract the cap relief model’s equivalent draft pick value from the total pick value actually received by the seller. This leaves us with the following:
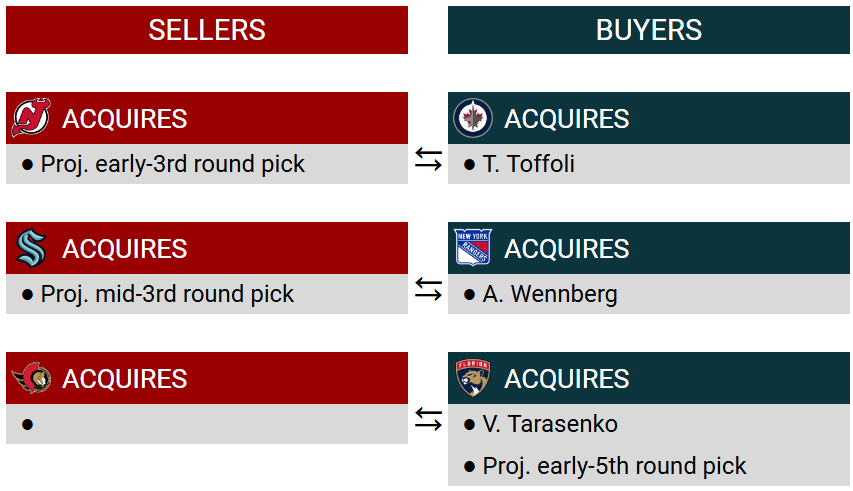
Our model suggests that New Jersey and Seattle got a similar return after calculating the pick and cap relief amounts for Toffoli and Wennberg, while Ottawa actually gave up value to Florida in their deal. A lot of this is based on projecting Florida’s picks based on their deadline PTS% rank (1st), though, so take that with a grain of salt.
Pick Chart Arbitrage
Before we continue, I should remind the reader that the value system we’re working with is a market value one. In addition to draft pick market value models, teams also have performance-based models that value picks based on the aggregate statistics of players taken at each pick number. If a team has faith in their performance-based model, they should internally value draft picks using this system, while using the market value model to determine what picks will actually be exchanged for. Thus, a team can lose on the market value model but win on their performance-based value model.
Remember this before deciding a team has won or lost a trade.
One More
Let’s finish up by trying to analyze one of the biggest moves from the deadline:
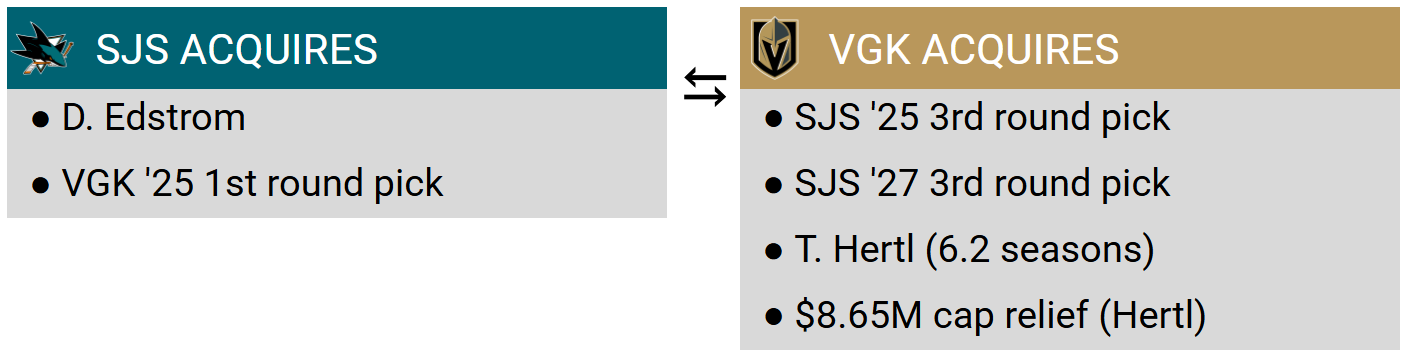
To reduce terms, our model says the combined value of the two third round picks that San Jose received is roughly equivalent to a mid-second round pick (again, projecting their round order based on PTS% as of the deadline).
As for the cap relief, Hertl’s contract has a total $50.6M owed over the rest of this and the next six seasons. San Jose retained 17.1% of it, totalling $8.65M over the same time frame. According to our model, retaining $8.65M in cap hit is roughly equivalent to a mid/late-first round pick.
Now, it should be mentioned that my model’s dataset does not contain examples of cap relief amounts in the range of $8M or more, and the rising cap over the next six years will certainly lessen the retention impact on the Sharks. It also doesn’t consider the negative value San Jose incurred by locking up their third retention spot for so long (I don’t know why they did that, by the way). It’s entirely possible that both teams saw the retention value differently.
Be that as it may, the model sees the first round pick that San Jose acquired from Vegas in this deal — likely a late-round pick — as roughly fair compensation for the retention of Hertl, so I canceled them out.
After these calculations, we’re left with this:

With these reduced terms, the last step is to ask “what is David Edstrom (selected 32nd overall by Vegas last draft) worth compared to a mid-second round pick?” This difference is what San Jose received in exchange for Hertl at $6.75M x 6.2 seasons ($50.6M total).
Is Hertl worth it? He’s been a consistent 0.75 - 0.80 P/GP player for five seasons, so Vegas will likely enjoy at least a few fruitful seasons from him beyond these playoffs. At the same time, he’s 30 years old and will certainly decline over the remainder of his deal. I’ll leave you to answer.
Admittedly, the analysis above isn’t working in exact values. But being able to value the draft pick and cap relief components of these deals gives us somewhere to start.
I’m signing off here. I’ll be back with another article looking at the value of salary relief compared to cap hit relief, and the value of picks in future seasons.
Thanks again to PuckPedia for allowing me to use their data and for making these tools and series of articles possible.